
CRM · 4 steps
Track sales on the CRM dashboard and analytics
See your pipeline value, win rate and follow-ups at a glance, dig into conversion and sources, and review everything that changed.
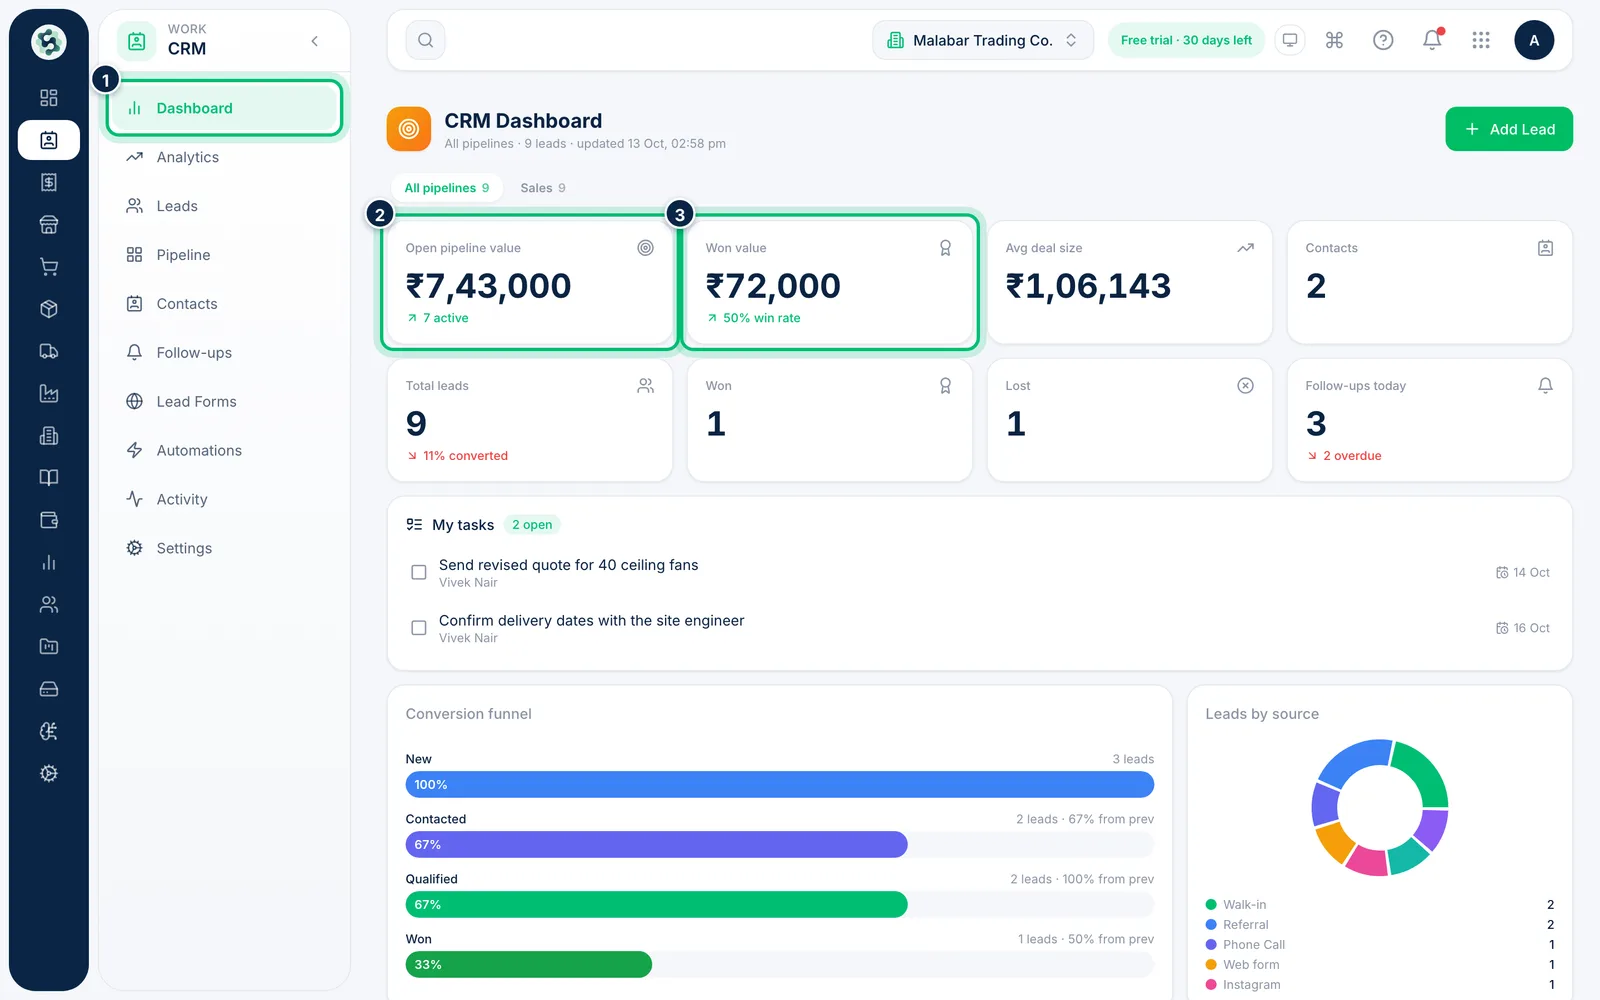
1Check the headline numbers
Go to CRM → Dashboard. The cards show your Open pipeline value, Won value, Avg deal size, Contacts, lead counts and Follow-ups today.
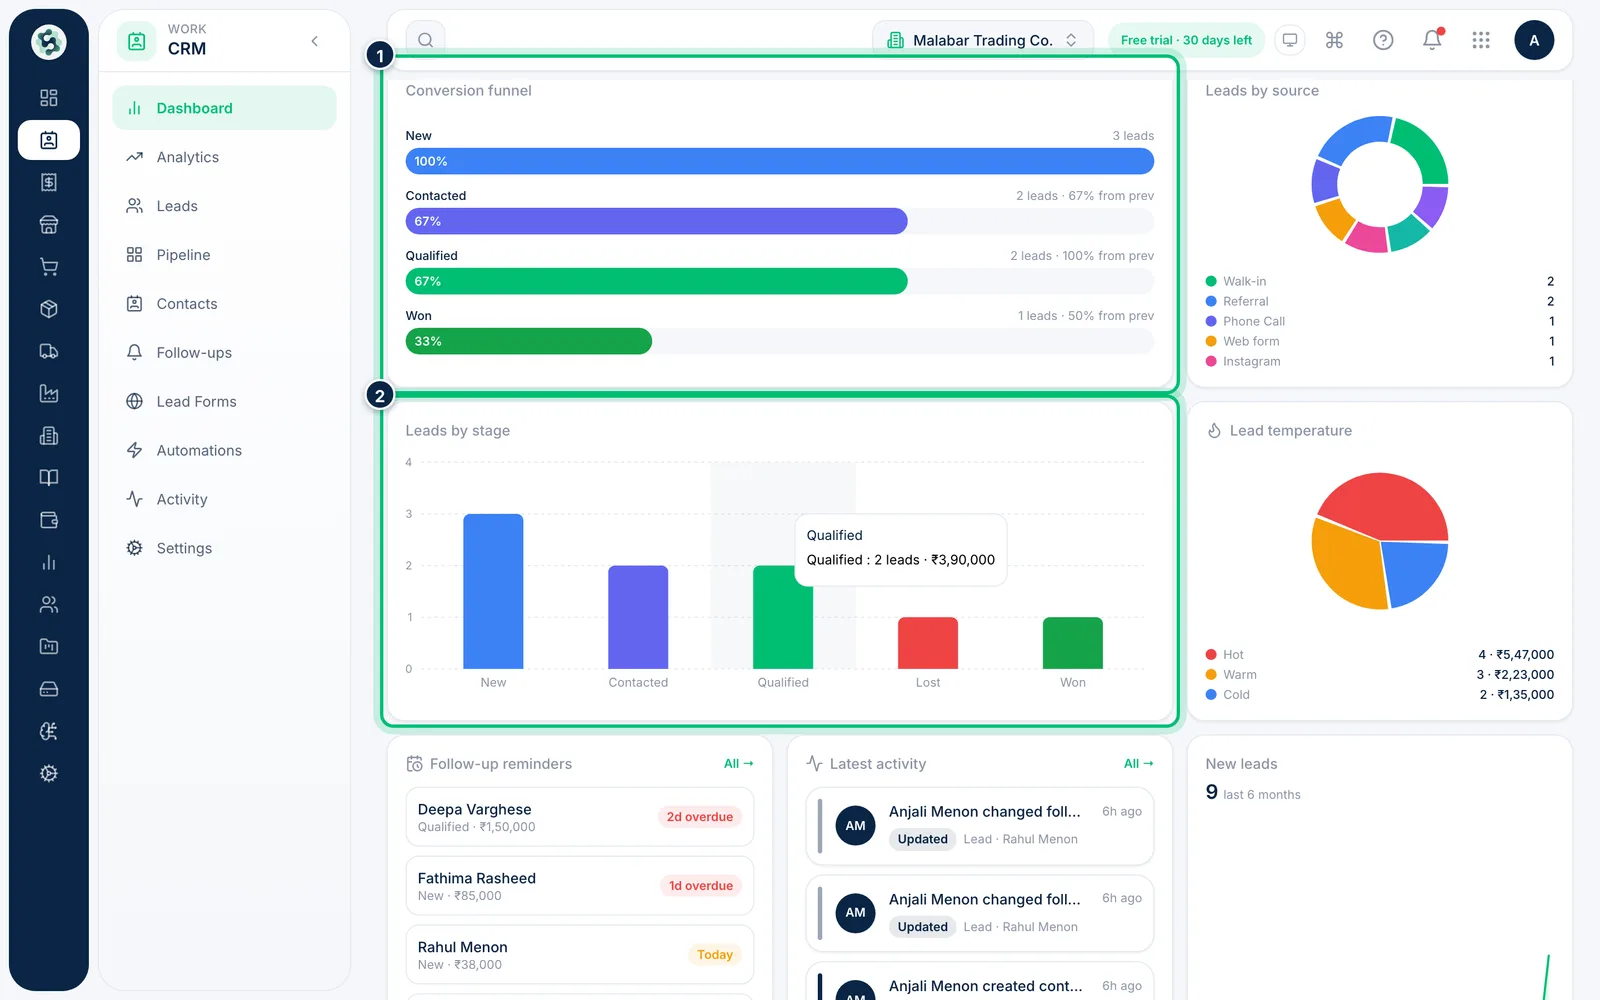
2See where deals stand
Further down, the Conversion funnel, Leads by source and Leads by stage charts show how leads flow. At the bottom, Top open deals lists the biggest deals still in play — click one to open it.
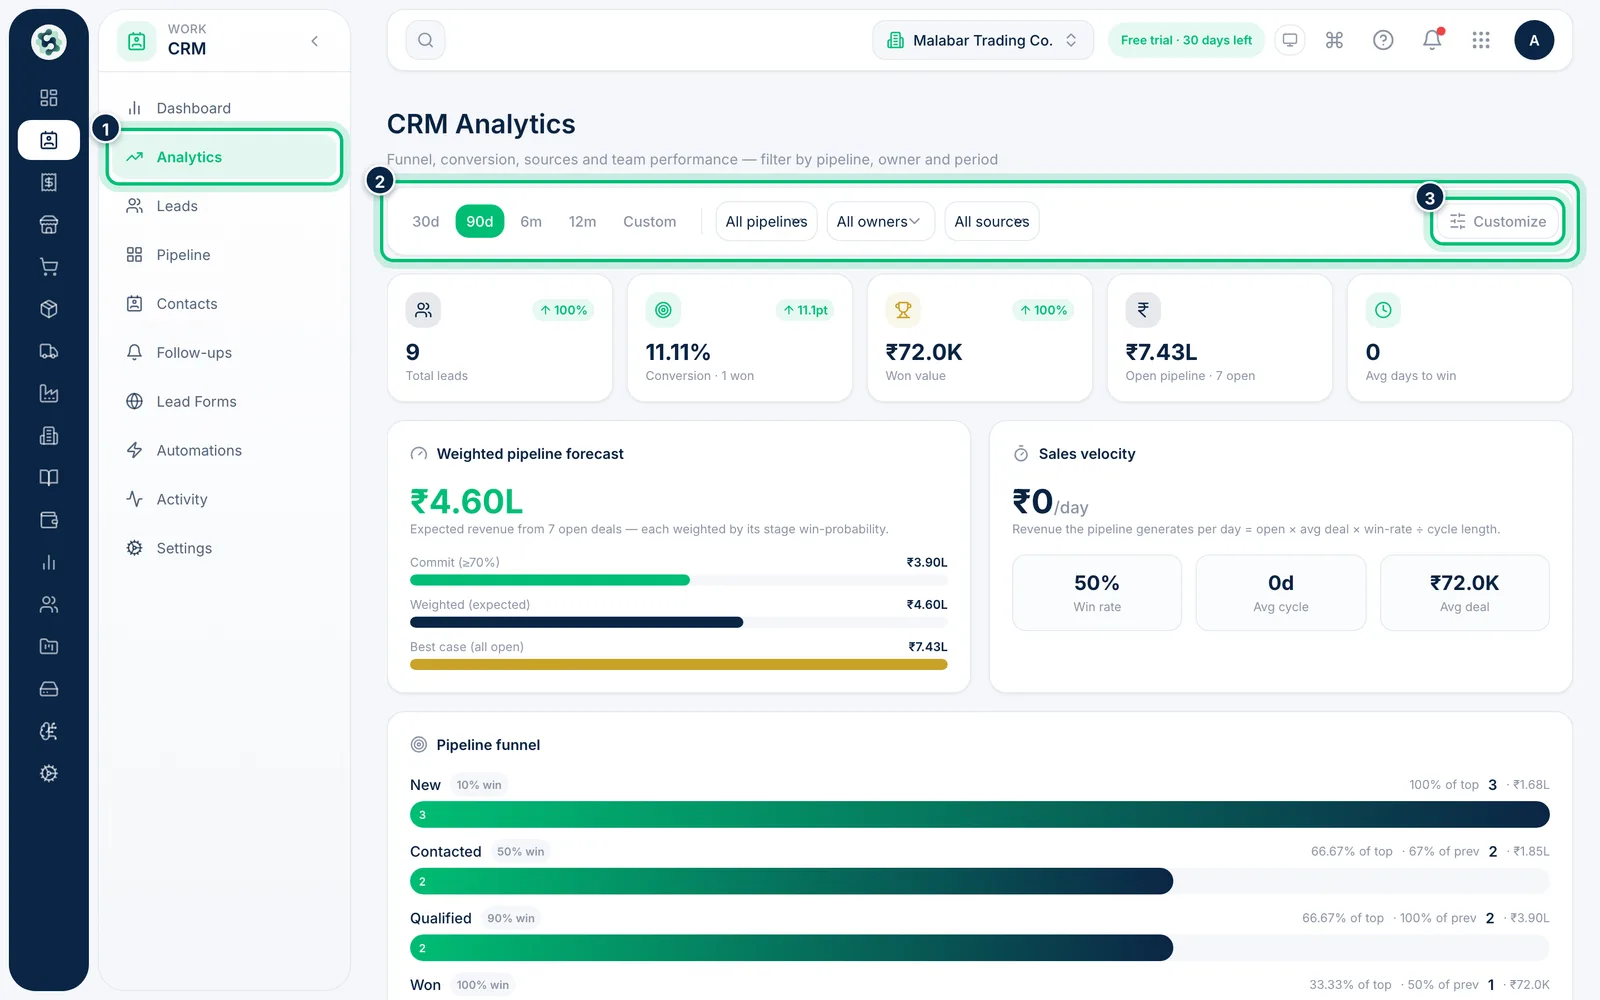
3Dig deeper in Analytics
Open CRM → Analytics for conversion, won value, days to win, a weighted forecast and source and team performance. Pick a period such as 90d, and filter by pipeline, owner or source. Customize chooses which widgets show.
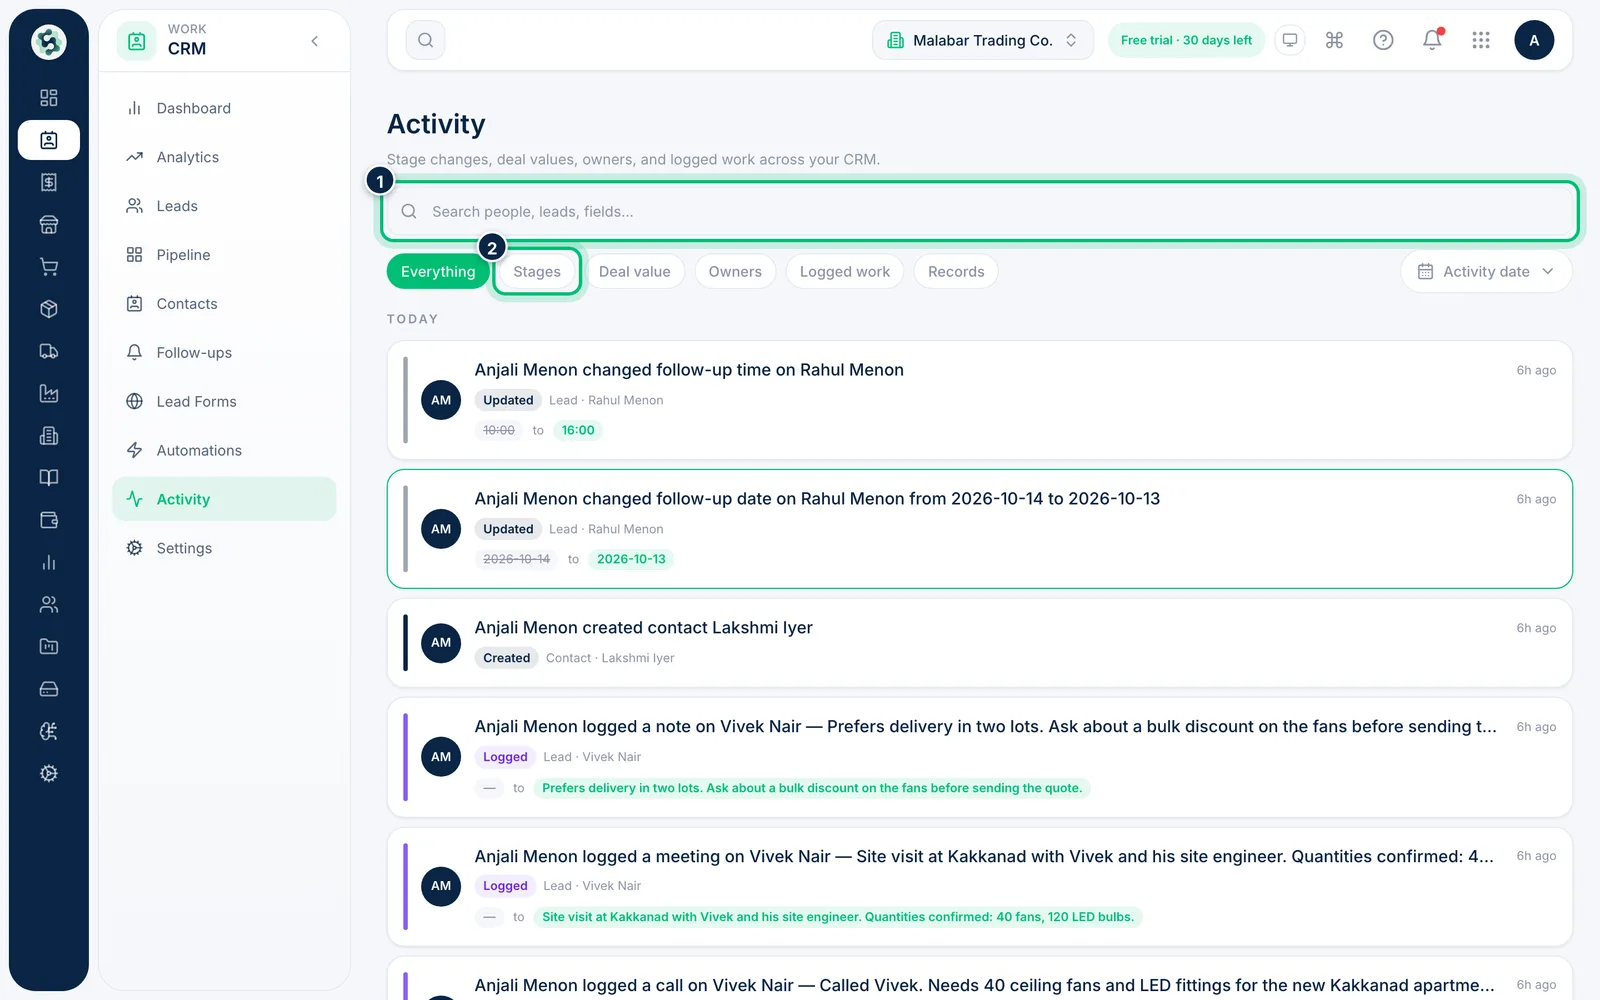
4Review recent activity
Open CRM → Activity for a day-by-day feed of stage changes, deal values, owners and logged work across all leads. Use the chips — Stages, Deal value, Owners, Logged work or Records — or search to find a change.
Related guides
Still stuck? Contact our support team — or start a free trial to try this in your own company.