
Reports · 4 steps
Read the Analytics & Reports dashboard
Get a cross-module view of revenue, spend, profit and stock, and find every report in one library.
Before you start: The dashboard fills itself from your invoices, bills, stock and leads. There's nothing to set up first.
1Open Analytics and Reports
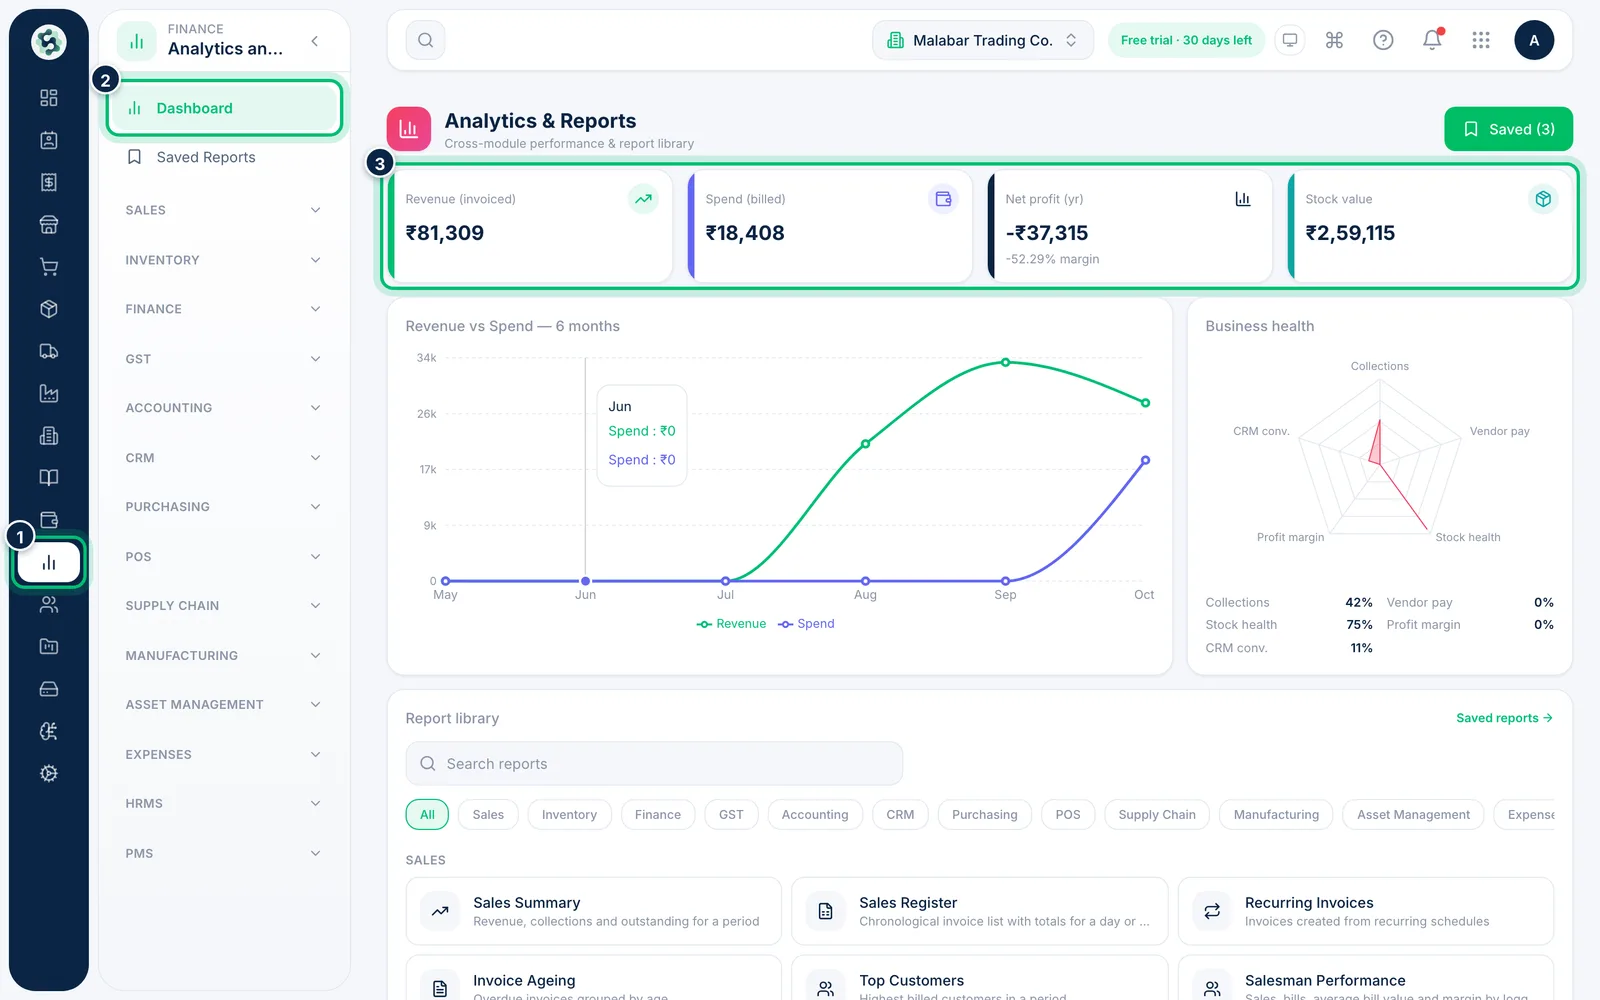
In the left icon bar choose Analytics and Reports. It opens on the Dashboard. The four tiles at the top show Revenue (invoiced), Spend (billed), Net profit (yr) with its margin, and Stock value.
2Compare revenue with spend
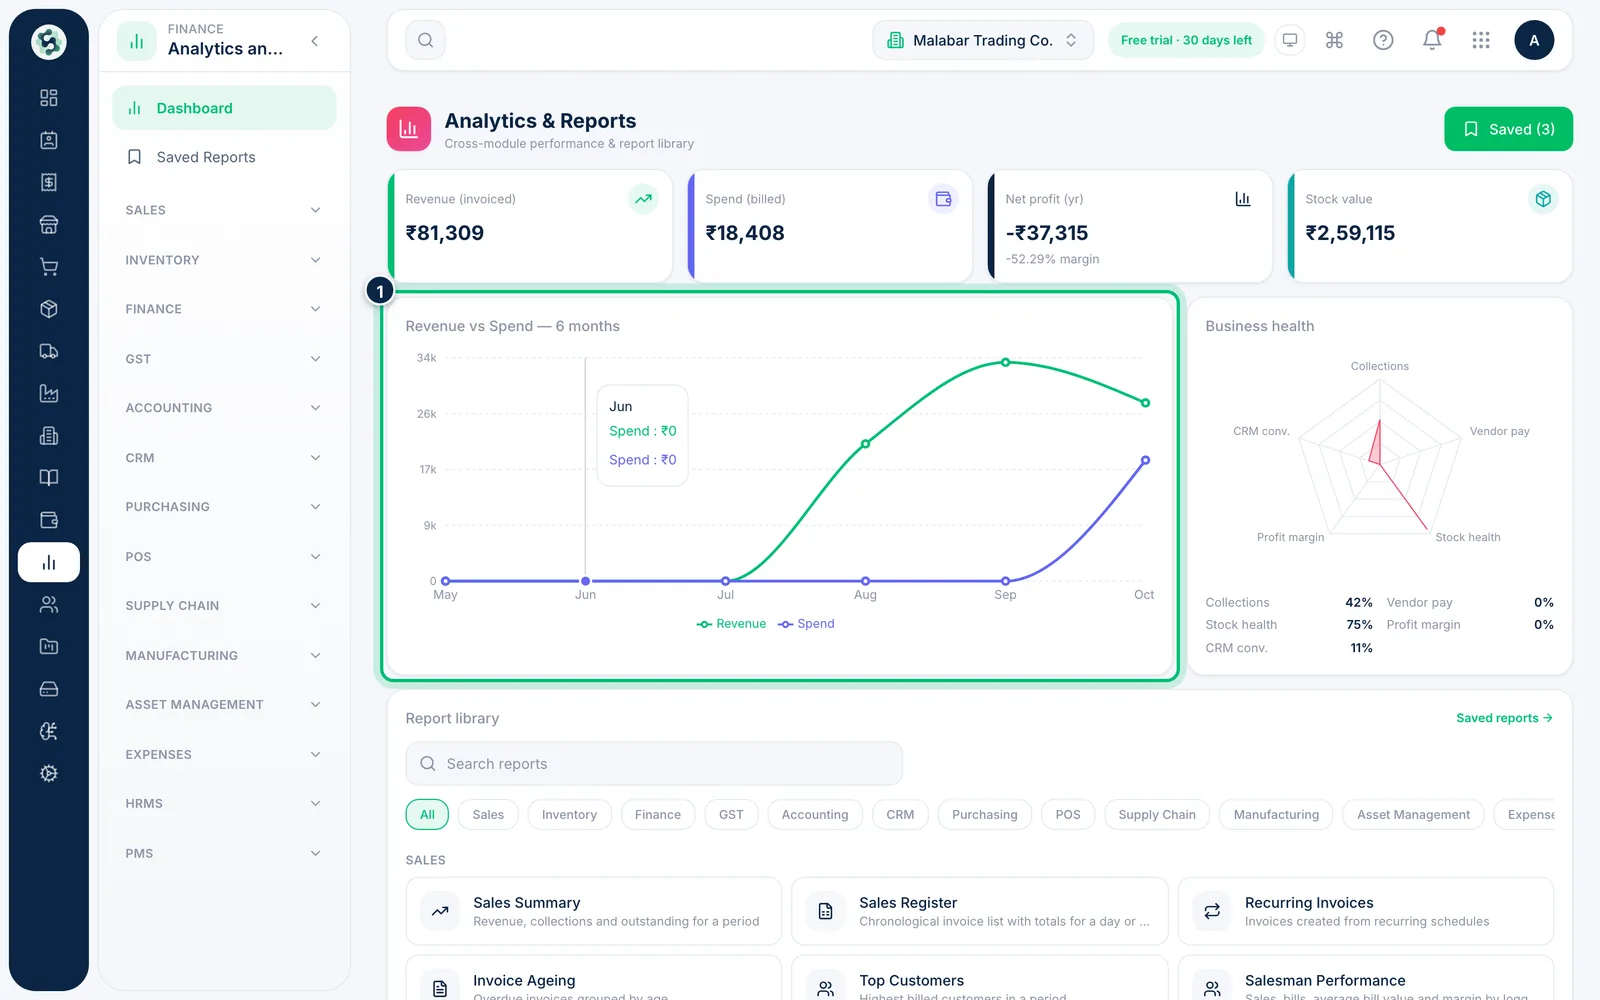
Revenue vs Spend — 6 months plots what you invoiced against what you were billed, month by month. Hover over a point to see the exact amounts.
3Check business health
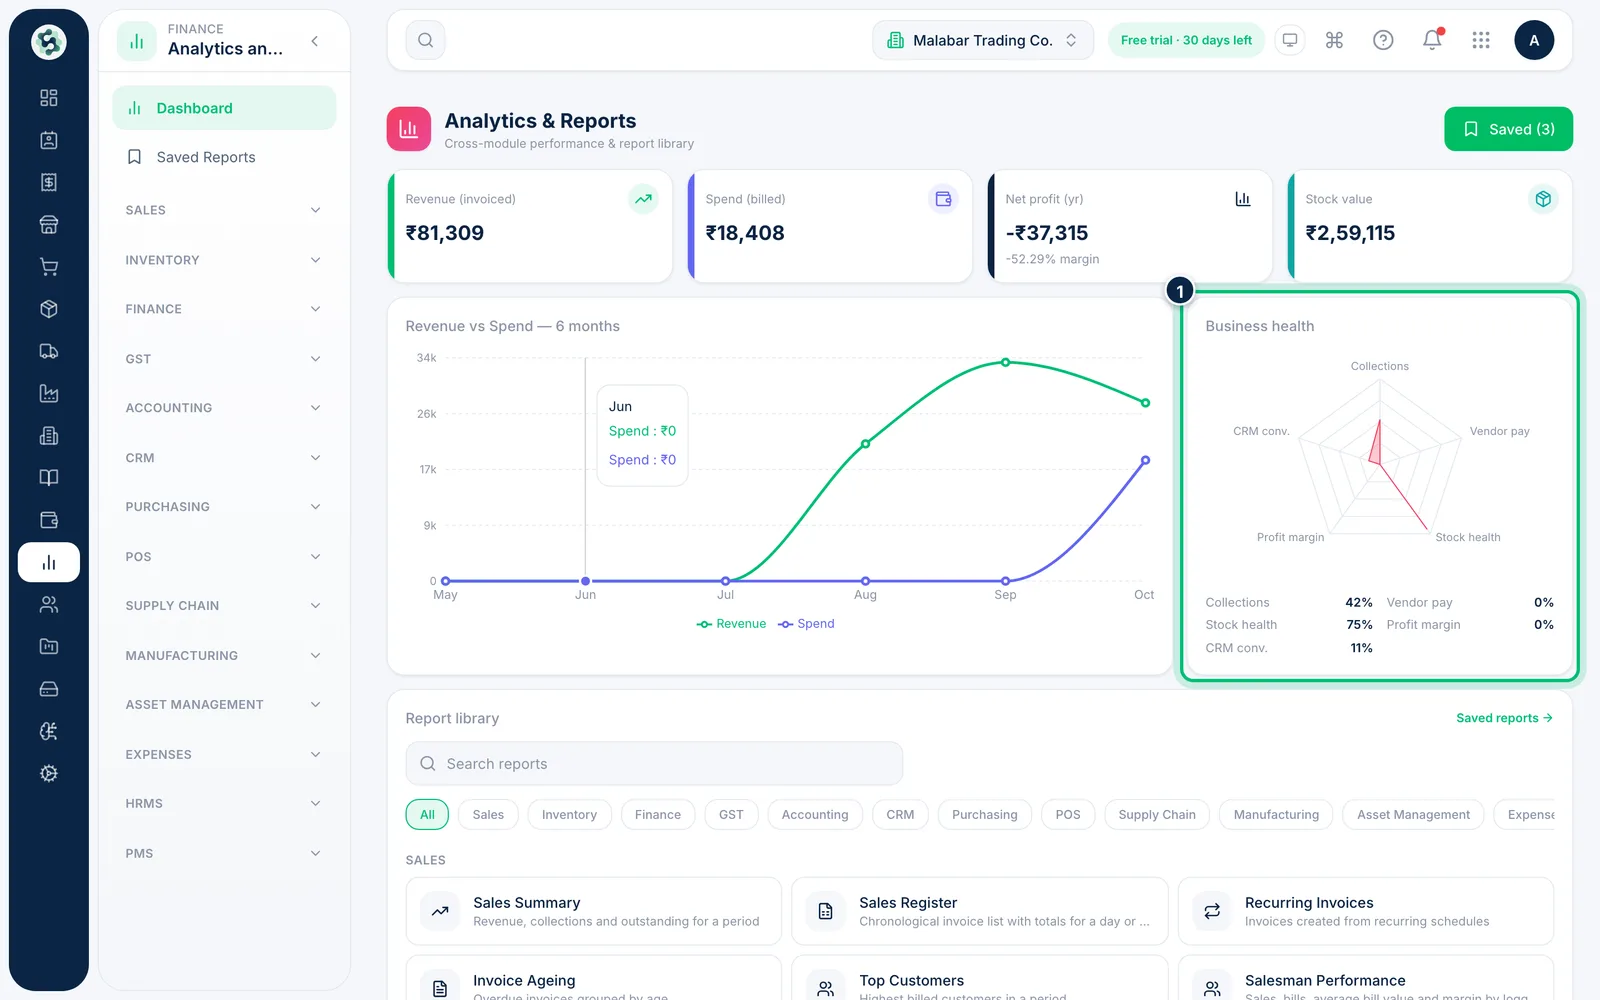
Business health scores five areas out of 100%: Collections (how much of what you invoiced has been paid), Vendor pay, Stock health (items above their reorder level), Profit margin and CRM conv. (leads won). A small shape points to the areas that need attention.
4Browse the report library
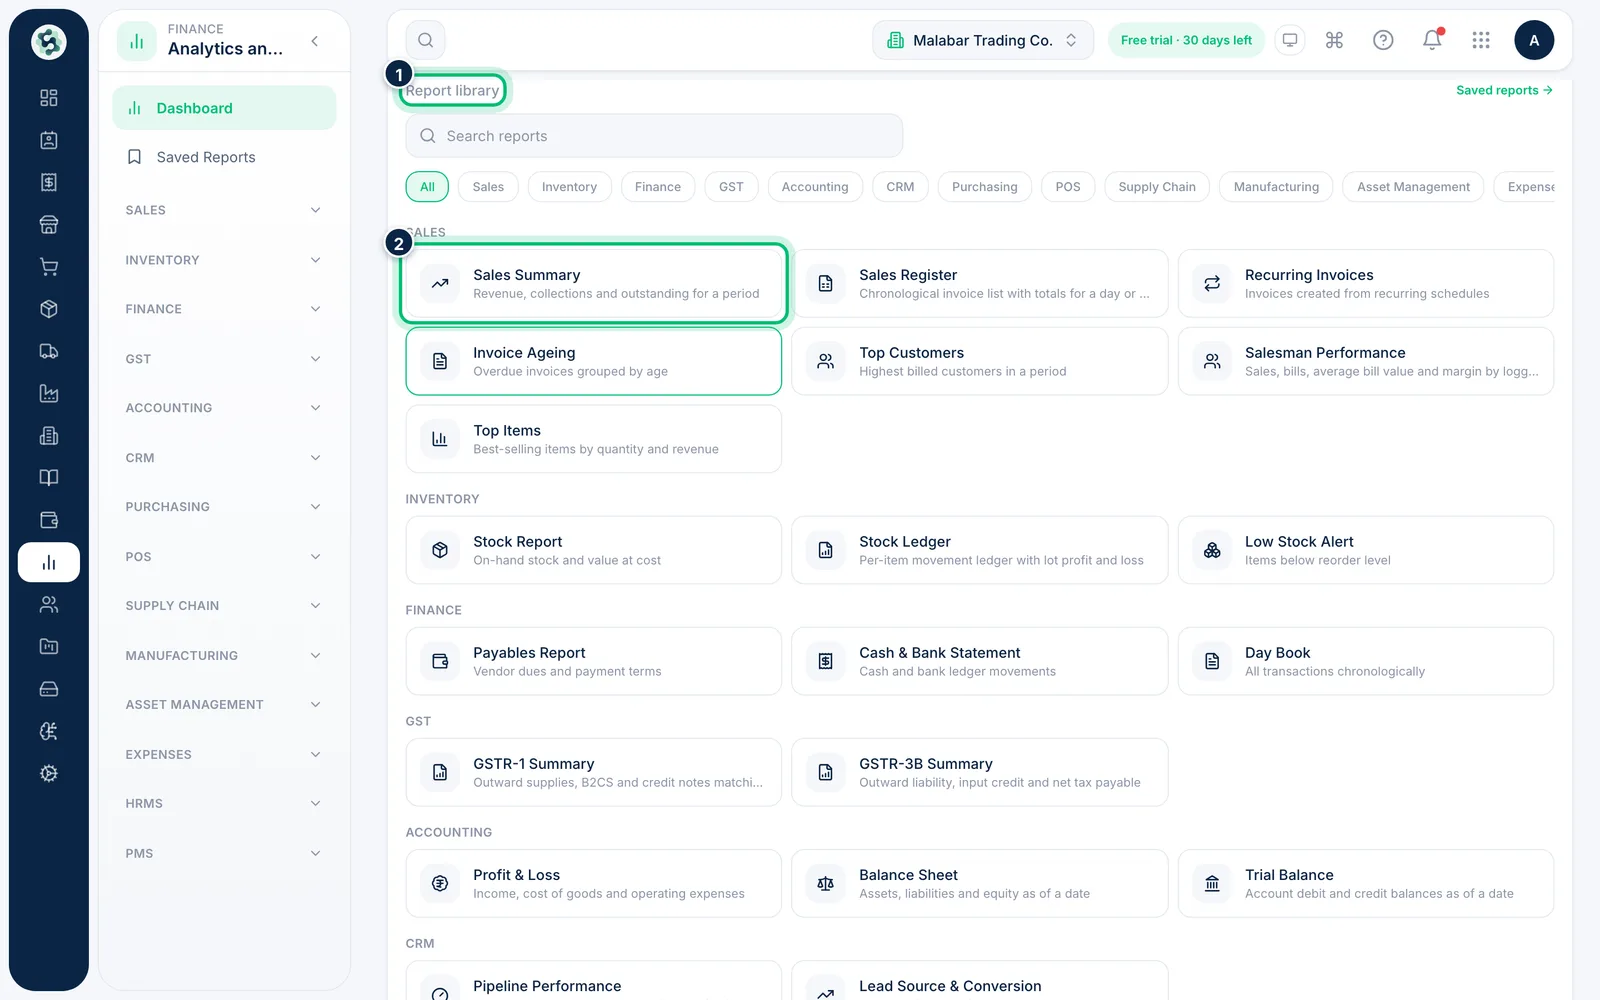
Scroll down to the Report library. Reports are grouped by area — Sales, Inventory, Finance, GST, Purchasing and more. You only see the reports your role has access to; a lock means the report needs an add-on.
Related guides
Still stuck? Contact our support team — or start a free trial to try this in your own company.